View Application Logs
Viewing logs is essential for monitoring application behavior, debugging issues, and troubleshooting deployment problems. Airbase provides log access through the Console web interface.
View Logs in Console
The Airbase Console provides a web-based interface for viewing logs with environment selection and real-time streaming.
Step 1: Navigate to Project Logs
- Go to Airbase Console
- Find your project and click on it
- Click Logs in the side navigation bar
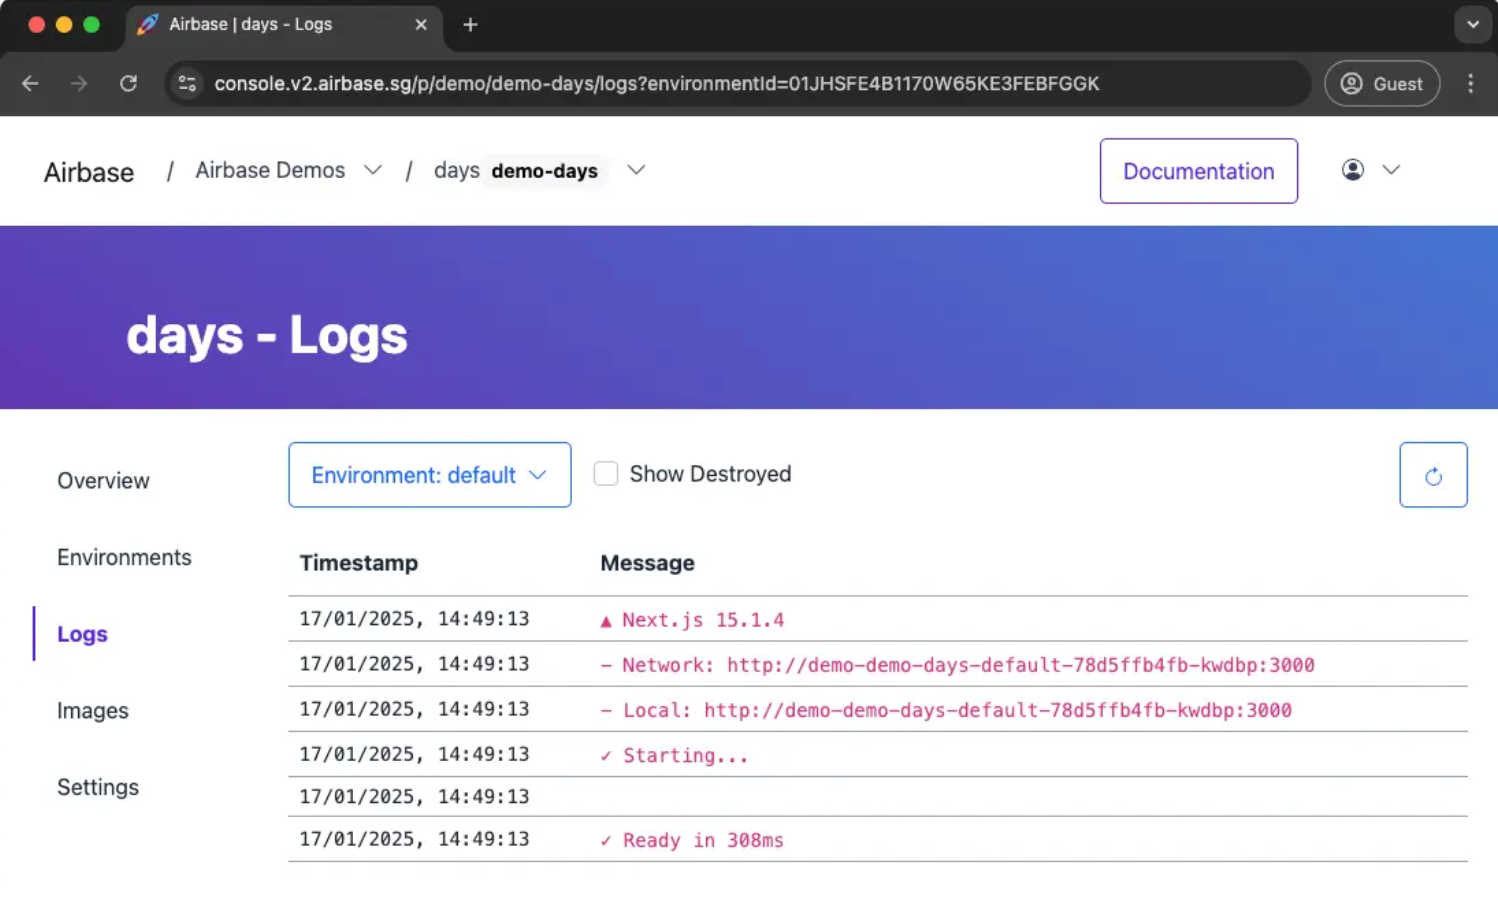
Step 2: Select Environment
In the logs pane, select the environment you want to view from the dropdown menu:
- production - Production environment logs
- staging - Staging environment logs
- custom environments - Any other environments you've created
The logs will automatically load and stream in real-time.
Features
- Real-time streaming: Logs update automatically as new entries arrive
- Environment switching: Quickly switch between different environments
- Scrollable history: View recent log history
- Search/filter: Find specific log entries (browser search)
Searching and Filtering Logs
Use your browser's search functionality (Ctrl+F / Cmd+F) to search through the logs displayed in the Console.
Common Search Patterns
Search for errors: - Search for: error, Error, ERROR
Find specific error types: - Search for: TypeError, ReferenceError, SyntaxError
Check for memory issues: - Search for: OOM, memory, killed, out of memory
Find warnings: - Search for: warn, warning, WARN
Find critical issues: - Search for: critical, fatal, CRITICAL, FATAL
Debugging Deployment Issues
Check if application is starting: - Search for: server, listening, started, ready
Find startup errors: - Search for: error, failed, cannot, unable
Check for port binding issues: - Search for: port, EADDRINUSE, address in use
Database Connection Issues
Check database errors: - Search for: database, postgres, mongo, connection, sql
Find connection timeouts: - Search for: timeout, ETIMEDOUT, connection refused
Understanding Log Format
Standard Output and Errors
Airbase captures both stdout and stderr from your application:
Node.js example:
console.log('Server started');  // stdout - appears in logs
console.error('Database error'); // stderr - appears in logs
Python example:
print('Server started')  # stdout - appears in logs
import sys
print('Database error', file=sys.stderr)  # stderr - appears in logs
Structured Logging
For better log analysis, use structured logging:
Node.js with pino:
const pino = require('pino');
const logger = pino();

logger.info({ userId: 123, action: 'login' }, 'User logged in');
// Output: {"level":30,"time":...,"userId":123,"action":"login","msg":"User logged in"}
Python with structlog:
import structlog

logger = structlog.get_logger()
logger.info("user_logged_in", user_id=123, action="login")
Log Levels
Use consistent log levels for filtering:
- DEBUG: Detailed diagnostic information
- INFO: General informational messages
- WARN: Warning messages, potential issues
- ERROR: Error messages, application errors
- FATAL/CRITICAL: Critical errors, application crash
Best Practices
✅ Do's
- Use structured logging - Makes searching and filtering easier
- Include context - Log user IDs, request IDs, timestamps
- Use appropriate log levels - Don't log everything as ERROR
- Log errors with stack traces - Include full error details
- Check logs regularly - Monitor for patterns and issues
- Log to stdout/stderr - Ensure logs are captured by the platform
Example: Good logging practice
logger.info({
  requestId: req.id,
  userId: user.id,
  action: 'purchase',
  itemId: item.id,
  amount: total
}, 'Purchase completed');
❌ Don'ts
- Don't log sensitive data - Passwords, tokens, PII
- Don't log excessively - Too many logs obscure important ones
- Don't ignore errors - Always log errors with context
- Don't use only console.log - Use proper logging libraries
- Don't log in tight loops - Can overwhelm logs
Example: Bad logging practice
console.log(user.password); // ❌ Never log passwords
console.log(creditCard.number); // ❌ Never log payment details
Troubleshooting
No Logs Appearing
Cause: Application not writing to stdout/stderr
Solution: - Ensure your application logs to stdout/stderr (not files) - Check your logging configuration - Verify application is running in Airbase Console
Node.js check:
// ✅ Good - logs to stdout
console.log('Message');

// ❌ Bad - logs to file (not captured)
fs.appendFileSync('app.log', 'Message');
Logs Cut Off or Truncated
Cause: Too many logs, older logs are rotated out
Solution: - Use browser search to find specific logs - Reduce log volume by adjusting log levels - Consider external logging service for long-term storage
Can't Find Specific Logs
Cause: Log format makes searching difficult
Solution: - Use structured logging with consistent format - Add timestamps to all log entries - Include unique identifiers (request ID, user ID) - Use browser search (Ctrl+F / Cmd+F) effectively
Logs Not Updating
Cause: Application may not be running or restarting
Solution: - Check deployment status in Airbase Console - Verify recent deployment was successful - Look for crash or restart messages in logs
Log Retention
Retention period: Logs are retained for approximately 7 days
For long-term storage: - Send logs to external logging service (e.g., CloudWatch, Datadog) - Implement application-level logging to external systems - Use structured logging with external destinations
See Also
- How-To: Troubleshoot CSP Violations - Using logs to debug CSP issues
- Reference: CLI Commands - Full CLI reference
- Reference: Instance Types - Using logs to check resource issues